Tutorial Plotters#
From V5.0.0.0 onwards of the TMSi Python Interface, a new structure for the plotters is integrated. In this tutorial, a general outline of the plotter structure is given. At the end of this page, you can find an overview of the step-by-step tutorials for specific plotters.
General structure#
The new plotters have a new structure and are based on inheritance. A new class, the Plotter Helper class (after this called the Helper), has been developed in this version of the SDK.
The Helper class is a class where you can make your changes if you wish to have a different plotter from the ones delivered by default.
Globally, the structure of the new plotters is like this:
Top layer: The main file or example file that connects to the device, defines the device configuration and which
Helperyou will use. It calls theGUIwith the correctHelperthat defines whichPlotteryou will see.Second layer: The
GUIthat opens the window for thePlotterand shows the correctPlotterbased on the information given theHelperclass.Third layer: The
Helperthat has the ability to process the data, handles multiple plotters and defines whichPlotterto use. This is the layer to adjust if you wish to customize yourPlotter.Fourth layer: The
Plotter, that can edit what you can see from the data coming from theHelper(for example enabling/disabling the visibility of channels) and plots the data.
Looking at the layers, layer 1 and 3 can control the device, while layer 2 cannot. Layer 4 is a passive layer that can only do as desired by the layer above it. You can adjust the control of the device in layer 1 and customize what you want to display in layer 3.
In this tutorial, all layers will be explained one by one. Graphically, the structure explained above is summarized in Figure 1.
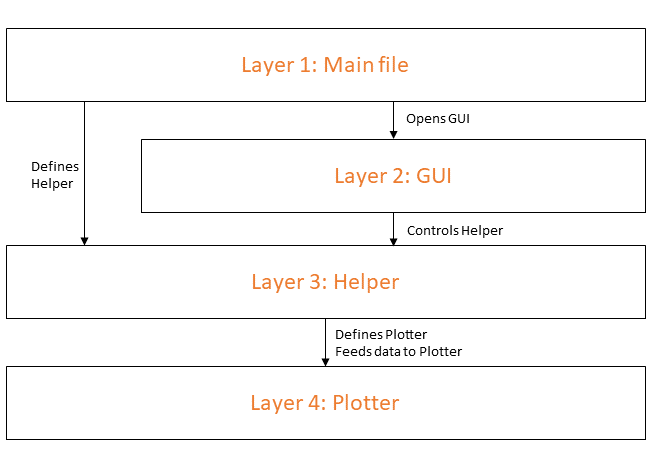
Figure 1: Overview of the general structure of the Plotters in the V5.0.0.0 release#
Layer Overview#
In this paragraph, the role of every layer is explained in more detail.
Top Layer: The main file or example file#
The main file discovers and connects to the device. It can update the configuration of the device and open the filewriter to store data. It defines
which Helper to use and initializes the Helper. Then, it executes the GUI using the Helper. When the GUI is closed by the user, the measurement is stopped and the filewriter and the connection
to the device is closed. This process is summarized in Figure 2.
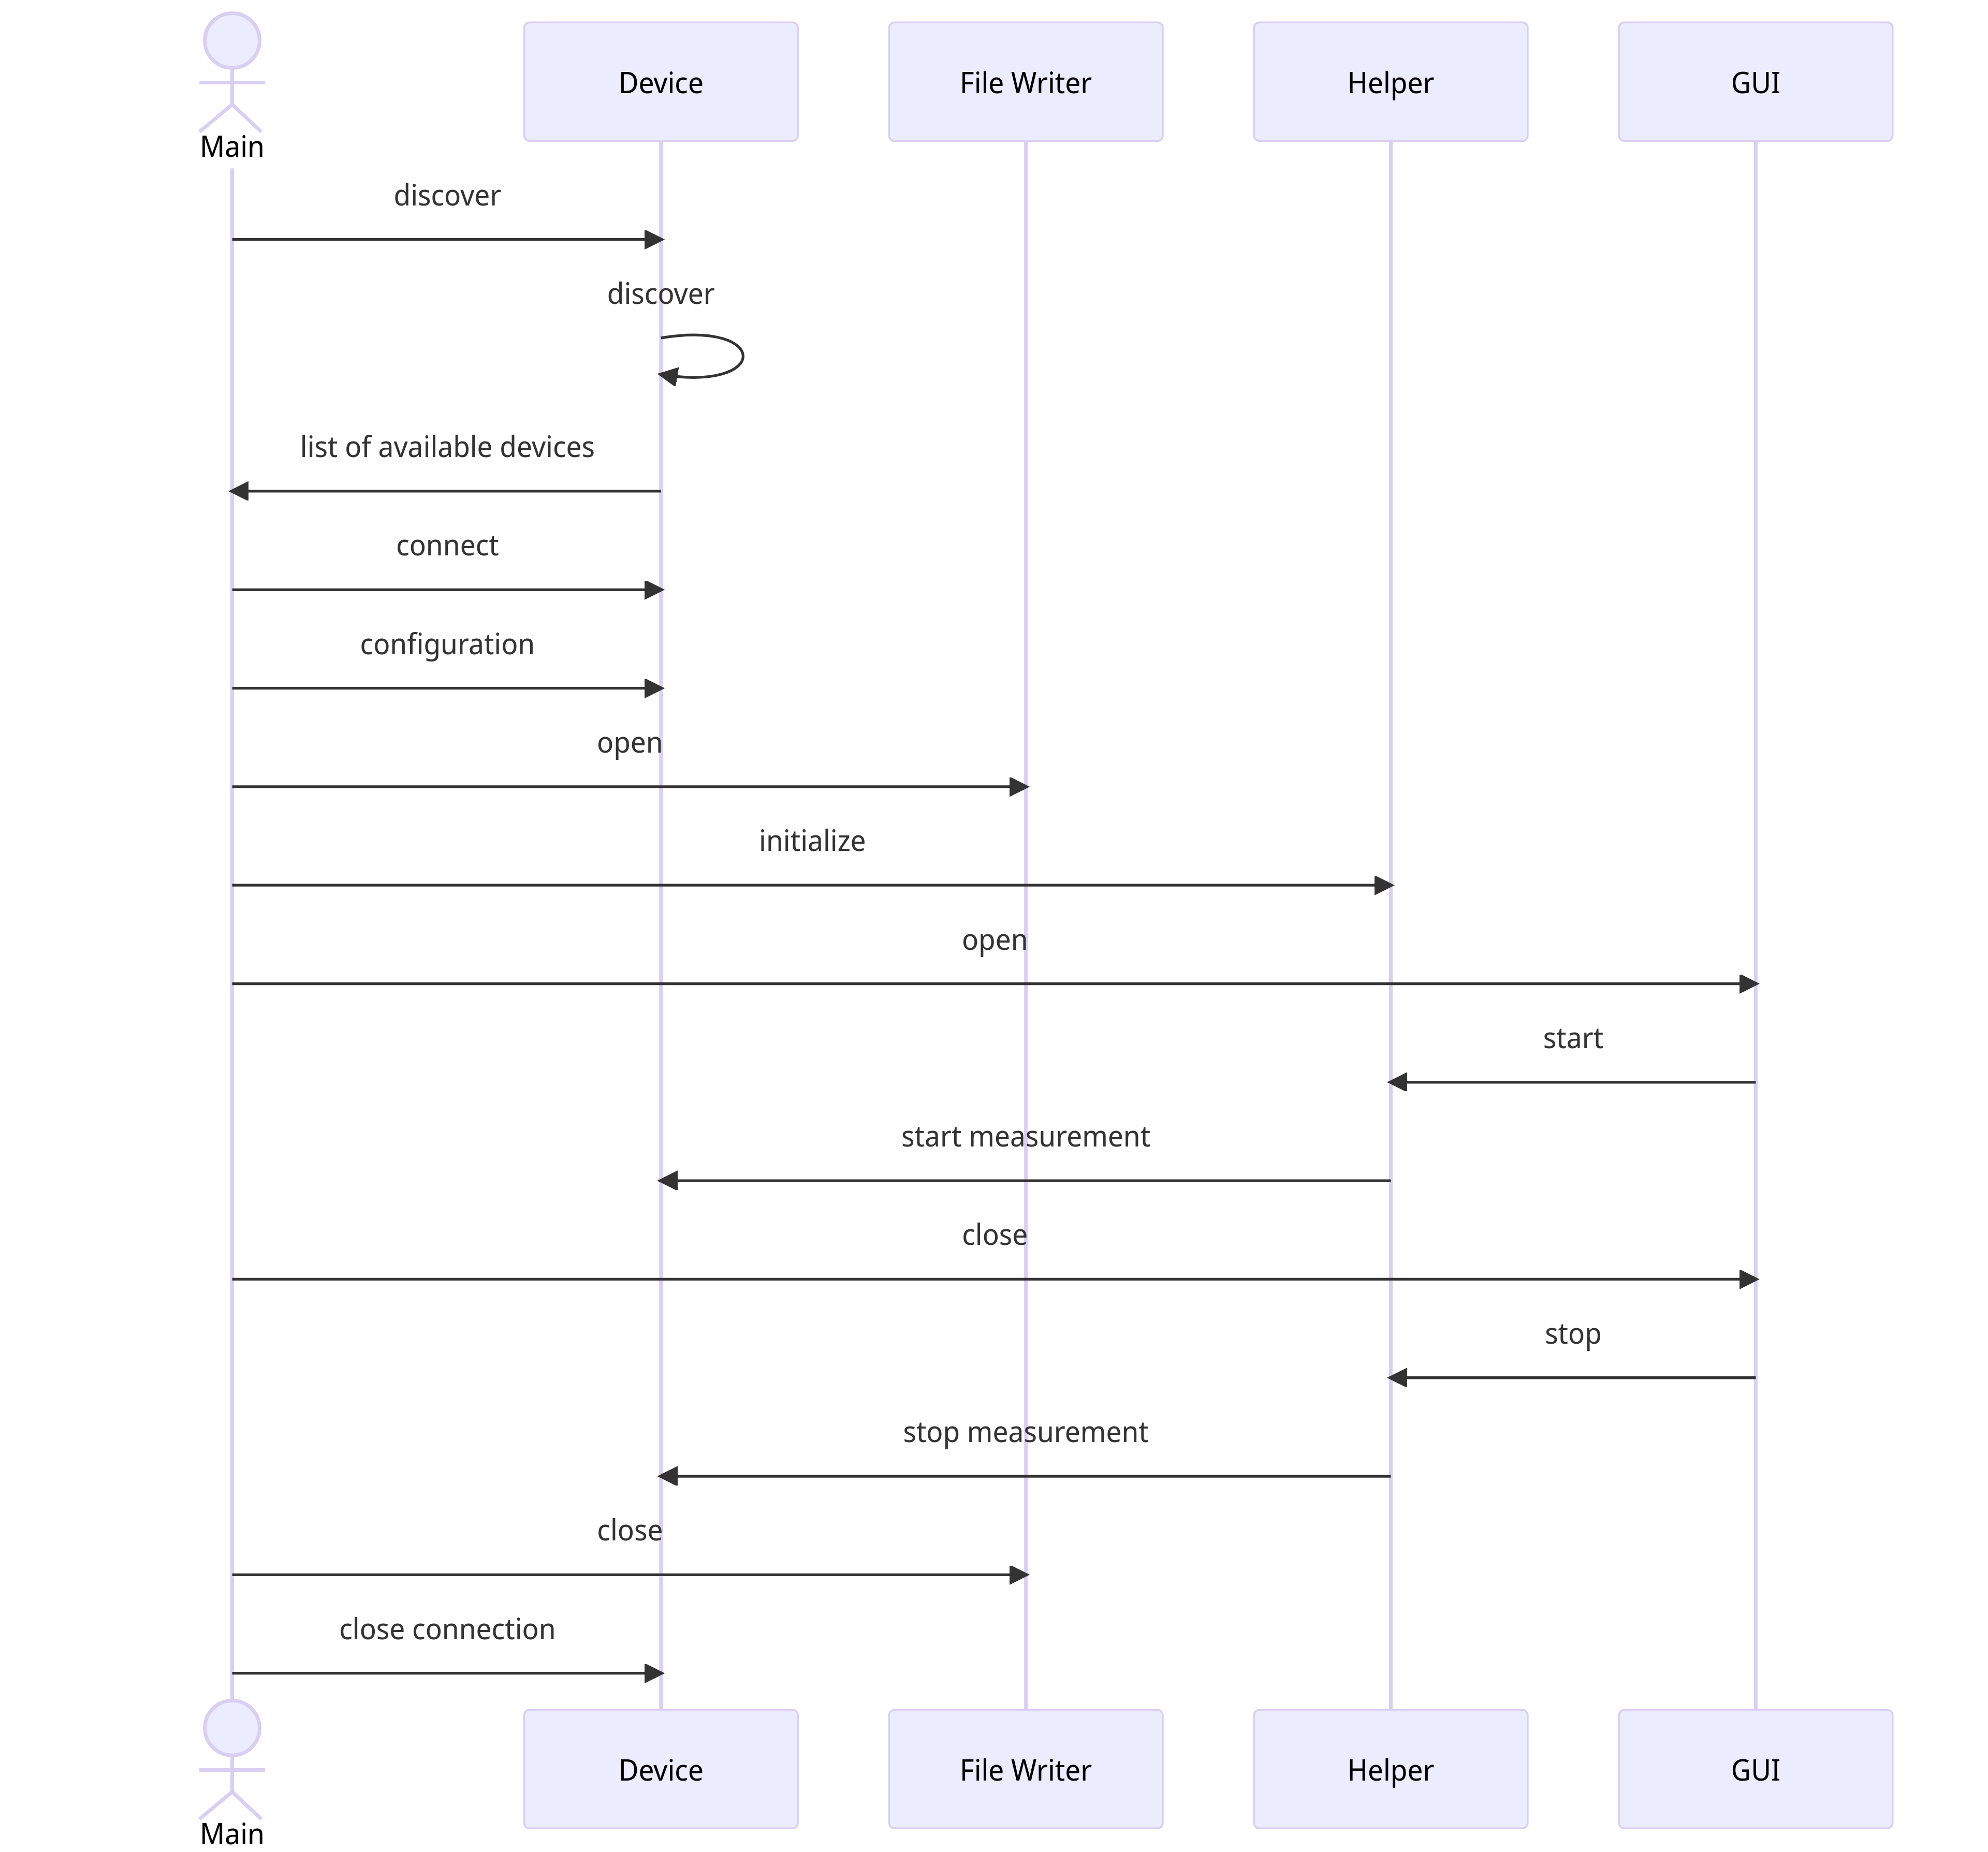
Figure 2: Unified Modeling Language (UML) diagram of the main file#
Second layer: The GUI#
The GUI is the layer that opens the window for the Plotter and adds the Plotter to the window based on the Helper. It initializes and
starts the Helper and closes it on the user’s command. It does not have any interaction with the device.
Third layer: The Helper#
The Helper contains the control of the device as well as the control of the reading of the data and the
processing of the data before it is sent to the Plotter. First, it initializes a Consumer and the ConsumerThread. The Consumer connects to the sample
data server and puts the data in a queue. The ConsumerThread reads the queue and puts the data in a buffer. This Buffer is a circular buffer which is
filled from start to end and then restarts from the beginning. The pointer keeps track of where the new data is added.
After initializing and defining the Consumer and ConsumerThread, the Helper initializes the Plotter to be used and starts the data acquisition from the device.
Then, it initializes the Monitor. The Monitor outputs the data buffer to the Helper using the monitor function. The Helper receives the results of
the monitor function in the callback function. The callback function receives, processes and sends the data to the Plotter.
The workflow of the Helper is given in Figure 3.
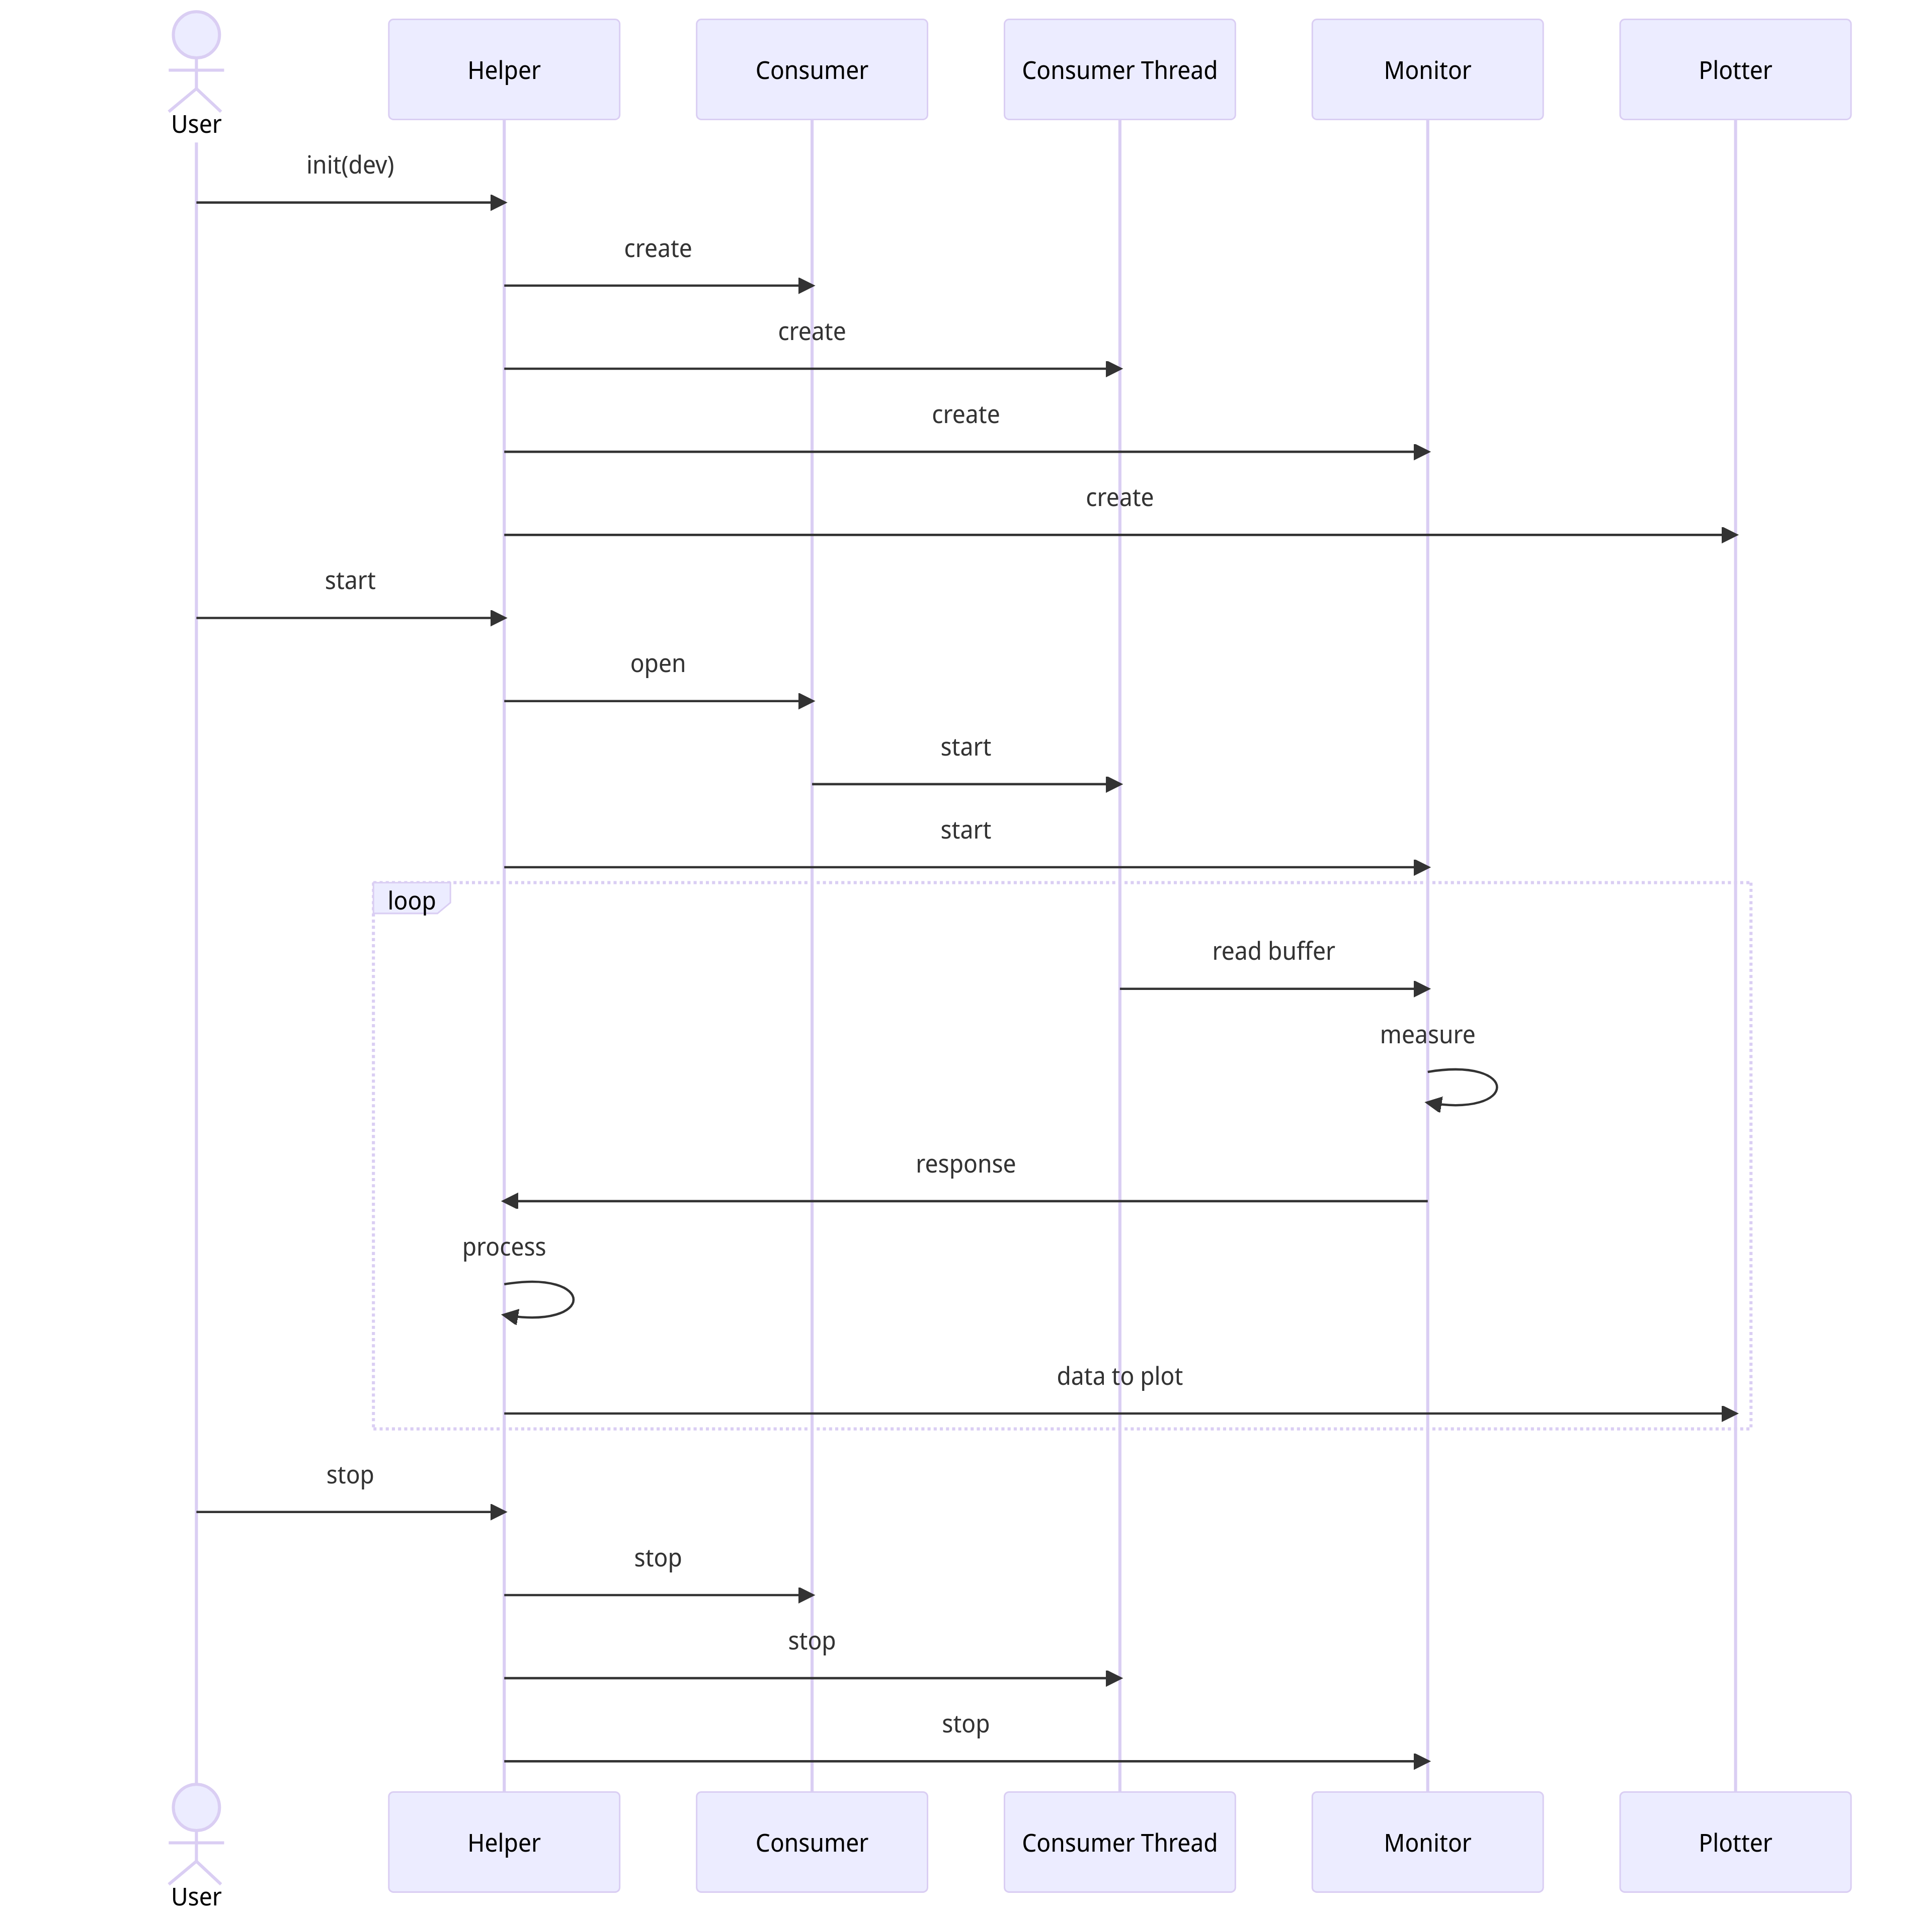
Figure 3: Unified Modeling Language (UML) diagram of the Helper class#
Fourth layer: The Plotter#
The Plotter intializes the Plotter controls (for example, the autoscale button or enabled/disabled channels). It receives input
data from the Helper and processes and plots the data based on the controls. The Plotter does not have any interaction with the
device.
How to customize your own plotter?#
In case you want to change the Helper, there are a couple of points where you might want to make changes: the callback() function or the
ConsumerThread in combination with the monitor function. Any processing that can be done with the data buffer is suggested to be performed in the
callback() function (Tutorial 3), while processing that has to be done on a lower level is done is the ConsumerThread (see Tutorial 1).
For step-by-step guidance, please read through the following tutorials: