Tutorial HD-EMG Workflow#
This tutorial provides a step-by-step guide on running the example_EMG_workflow.py located inside the examples_SAGA folder.
Adding the correct directory of files#
To recognize the TMSi Python Interface folder, which is necessary for running the examples, your Python interpreter needs to know the corresponding path. Therefore, the first lines of code add this information. If you wish to store the recordings in a different folder than the default one, you can change the directory given in line 40.
36import sys
37from os.path import join, dirname, realpath
38Example_dir = dirname(realpath(__file__)) # directory of this file
39modules_dir = join(Example_dir, '..') # directory with all modules
40measurements_dir = join(Example_dir, '../measurements') # directory with all measurements
41configs_dir = join(Example_dir, '../TMSiSDK\\tmsi_resources') # directory with configurations
42sys.path.append(modules_dir)
43import time
Importing the required classes and functions from TMSi SDK#
These are the libraries which are implemented by TMSi and are required for the example script to work. They are used for purposes such as handling errors, writing recording files on PC, and plotting incoming data.
45from PySide2.QtWidgets import *
46
47from TMSiFileFormats.file_writer import FileWriter, FileFormat
48
49from TMSiSDK.tmsi_sdk import TMSiSDK, DeviceType, DeviceInterfaceType, DeviceState
50from TMSiSDK.tmsi_errors.error import TMSiError
51
52from TMSiGui.gui import Gui
53from TMSiPlotterHelpers.impedance_plotter_helper import ImpedancePlotterHelper
54from TMSiPlotterHelpers.heatmap_plotter_helper import HeatmapPlotterHelper
Finding connected devices#
It’s possible to have more than one device connected. The Python Interface can be used to discover each device. Therefore, it’s necessary to specify the type of connected device as well as the interface via which the device is connected to PC (line 58). For SAGA amplifiers, the Docking Station (DS) is always connected via USB. The connection of the Data Recorder (DR) with the DS can be either docked, optical or wifi. In this case, the example uses a docked SAGA.
Next, a list of connected devices (device type has already been specified) can be stored inside variable discoveryList. The next line of code (line 61) is a check to ensure that at least one device has been discovered. Next, the first discovered device with the selected interface is opened. The handle to this discovered device is stored in the variable dev. The dev.open() command opens a connection to SAGA.
57    # Execute a device discovery. This returns a list of device-objects for every discovered device.
58    TMSiSDK().discover(dev_type = DeviceType.saga, dr_interface = DeviceInterfaceType.docked, ds_interface = DeviceInterfaceType.usb)
59    discoveryList = TMSiSDK().get_device_list(DeviceType.saga)
60
61    if (len(discoveryList) > 0):
62        # Get the handle to the first discovered device and open the connection.
63        for i,_ in enumerate(discoveryList):
64            dev = discoveryList[i]
65            if dev.get_dr_interface() == DeviceInterfaceType.docked:
66                # Open the connection to SAGA
67                dev.open()
Configuring the device#
After opening the connection to the device, the correct measurement configuration needs to loaded. The configuration defines which channels are enabled, the used channel names and whether common reference or average reference mode is used. In this example, the grid type that is used is set first. There are multiple options for the type of grid, that are listed below the variable. The TMSi Python Interface comes with standard configurations, which are loaded in this example by lines 76 or 78 (depending on the SAGA version). The configuration is different for a 32-channel or a 64-channel SAGA. The configuration .xml files sets common reference mode, the correct channel names and that all non-UNI channels are disabled. The default sampling rate for HD-EMG is set to 2000 Hz.
70        grid_type = '4-8-L'
71        # options:'4-8-L', '6-11-L', '6-11-S', '8-8-L', '8-8-S', '6-11-L-1', '6-11-L-2', '6-11-S-1', '6-11-S-2', '8-8-L-1', '8-8-L-2', '8-8-S-1', '8-8-S-2'
72
73        # Load the HD-EMG channel set and configuration
74        print("load HD-EMG config")
75        if dev.get_num_channels()<64:
76            dev.import_configuration(join(configs_dir, "saga32_config_textile_grid_" + grid_type + ".xml"))
77        else:
78            dev.import_configuration(join(configs_dir, "saga64_config_textile_grid_" + grid_type + ".xml"))
The plotter: check impedances#
Before starting the measurement, it is important to check the impedances. The impedances are an indicator for signal quality. In general, the lower the impedance, the better the signal quality. Please note that with HD-EMG grids, if they are not prepared properly, cross-bridges may occur. In the following code snippet the impedances are checked by visually inspecting the impedances per electrode. The required graphical user interface (GUI) and plotter were initially imported from TMSiGui and TMSiPlotterHelpers. (for more information about the plotters, please read the Plotters Tutorial). In this case, the ImpedancePlotterHelper is initialized in lines 86 to 88. Three parameters can be specified for the impedance plotter. The first parameter is the device that is passed to the Helper. The second variable, the layout variable, defines if the electrode impedances should be visualized as a head (for EEG) or in a Grid form (for HD-EMG). Finally, the impedances can be stored in a file: the third parameter defines the location and name of the file.
80        # Check if there is already a plotter application in existence
81        app = QApplication.instance()
82
83        # Initialise the plotter application if there is no other plotter application
84        if not app:
85            app = QApplication(sys.argv)
86
87        # Initialise the helper
88        plotter_helper = ImpedancePlotterHelper(device=dev,
89                                                 grid_type=grid_type,
90                                                 file_storage = join(measurements_dir,"example_EMG_workflow"))
91        # Define the GUI object and show it
92        gui = Gui(plotter_helper = plotter_helper)
93         # Enter the event loop
94        app.exec_()
Writing measurement to file#
The TMSi Python interface allows to record data in either .XDF or .Poly5 format. Therefore, the user is asked to provide a desired file format (line 101). Lines 104 to 110 ensure that the specified file format is initialized. Here, it is also possible to specify the directory in which the recordings are stored. The default is set to the measurement_dir (defined earlier) located inside the TMSi Python interface folder. Please note, if neither .XDF nor .Poly5 is given as input, the data will be saved as .XDF (lines 108 to 110). Moreover, it is required for the file_writer to get a handle to the device specified in the discoveryList, which is done in line 113. The default file name is example_EMG_workflow. If the user wishes to change the file name, lines 104-110 can be edited.
100        # Ask for desired file format
101        file_format=input("Which file format do you want to use? (Options: xdf or poly5)\n")
102
103        # Initialise the desired file-writer class and state its file path
104        if file_format.lower()=='poly5':
105            file_writer = FileWriter(FileFormat.poly5, join(measurements_dir,"example_EMG_workflow.poly5"))
106        elif file_format.lower()=='xdf':
107            file_writer = FileWriter(FileFormat.xdf, join(measurements_dir,"example_EMG_workflow.xdf"), add_ch_locs=False)
108        else:
109            print('File format not supported. File is saved to XDF-format.')
110            file_writer = FileWriter(FileFormat.xdf, join(measurements_dir,"example_EMG_workflow.xdf"))
111
112        # Define the handle to the device
113        file_writer.open(dev)
The plotter: heatmap plotter#
Once that the file format is chosen, a new plotter is initialized in line 118. In this case, a heatmap is created from the raw data. Therefore, the HeatmapPlotterHelper is initialized. Four parameters can be given to this Helper: the device should be passed, the layout of the grid that was specified in the beginning of the file is needed and the filter variables (order and cut-off frequency). In this case, a first-order high-pass filter with a cut-off frequency of 5 Hz is applied to the data. The plotter is opened when the GUI is initialized and the event loop has been started, which is done in line 122.
115        # Initialise the new plotter helper and filter
116        # In case you want to use the signal plotter, use the grid_type argument to order the channels
117        # following the order of the channels in the grid, see example_filter_and_plot
118        plotter_helper = HeatmapPlotterHelper(device=dev, grid_type=grid_type, hpf=5, order=1)
119        # Define the GUI object and show it
120        gui = Gui(plotter_helper = plotter_helper)
121         # Enter the event loop
122        app.exec_()
Closing the application#
After the measurement is performed and the plotter window is closed, the file_writer is stopped and the connection to the device is closed.
124        # Close the file writer after GUI termination
125        file_writer.close()
126
127        # Close the connection to the SAGA device
128        dev.close()
In case of any error, the Finally statement in line 134 properly closes the connection to the device if this has not been done before. Afterwards, it is possible to use SAGA again for a different application or a new measurement.
134finally:
135    if 'dev' in locals():
136        # Close the connection to the device when the device is opened
137        if dev.get_device_state() == DeviceState.connected:
138            dev.close()
Summary#
To wrap it up, assuming that the device driver is installed, recording data in Python using a TMSi amplifier is done by following the steps below. You can use the same flow to write your own script.
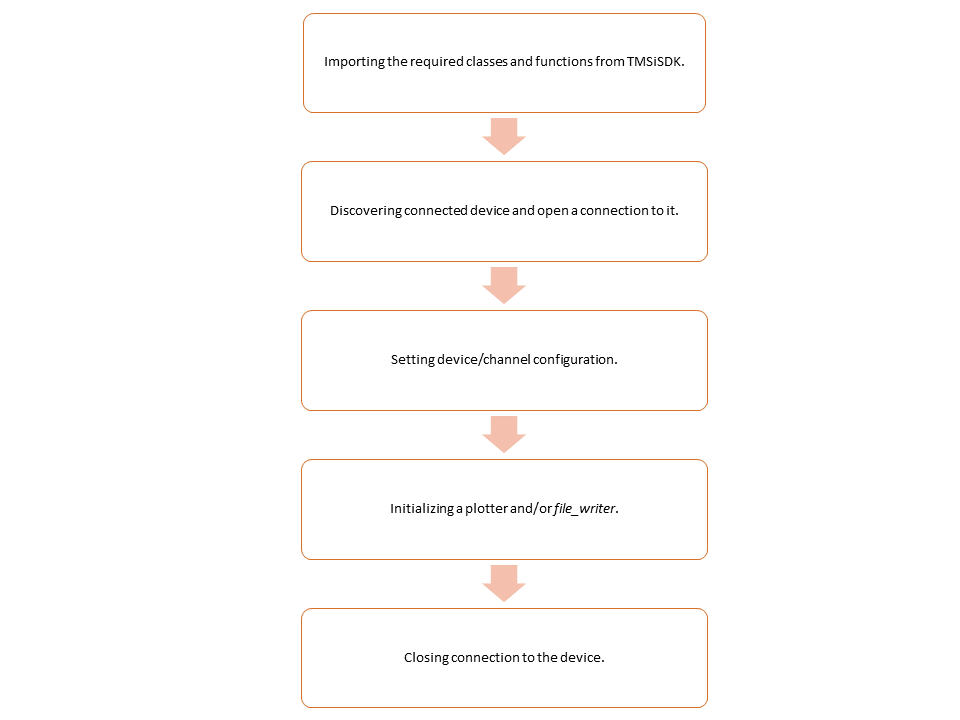
Figure 1: Overview of the general worflow to record data with a TMSi amplifier in Python#